
Root Cause Analysis (RCA) is a critical process in manufacturing that helps identify the underlying reasons for defects, failures, or issues in production. By understanding these root causes, manufacturers can implement effective solutions to prevent recurrence, improve quality, and optimise processes. This guide will walk you through the essentials of RCA, methods to carry it out, and its benefits.
What is Root Cause Analysis?
Root Cause Analysis is a systematic approach used to identify the fundamental reasons for problems or defects. Rather than just addressing the symptoms, RCA aims to pinpoint the core issues that lead to undesired outcomes. These core issues can then be addressed to reduce the likelihood of them happening again. This process is crucial in manufacturing, where consistent quality and efficiency are very important factors for success.
How to Carry Out Root Cause Analysis
At its core, a Root Cause Analysis involves carrying out a number of steps to try and identify why something happened. These steps are as follows:
Define the Problem
Firstly, you need to define the problem. Provide a detailed description of the problem, including what happened, where it occurred, when it was noticed, and how often it happens. In order to know why this is a problem, you also need to note the impact of said event. Explain the impact of the problem on production, quality, costs, and any other relevant factors.
Example:
- Problem: Increased defect rate in the assembly line.
- Impact: Higher rework costs, delayed shipments, and customer complaints.
Collect Data
Next, you need to gather relevant data to understand the problem's context and magnitude. Collect your data sources from things like production logs, quality control records, maintenance reports, and operator observations. Use both numerical data (e.g., defect rates, downtime) and descriptive data (e.g., operator notes, incident reports) to give you a full spectrum of data that will tell you the entire story. You can't identify a problem without checking every possibility first.
Example:
- Data: Defect rate increased from 2% to 5% in the past month. Most defects occur during the final assembly stage.
Identify Possible Causes
Thirdly, you need to brainstorm potential causes of the problem. Involve your entire team, including operators, engineers, quality control personnel, and maintenance staff, and use the data to think of as many causes as possible. It's useful to group potential causes into categories such as materials, methods, machines, people, and environment, and then go through each one individually.
Example:
- Potential Causes: Faulty components, improper assembly techniques, machine calibration issues, inadequate operator training, and environmental factors.
Analyse Causes
Next you should dig deeper into the possible causes and analyse them. Ask questions like what is the likelihood of this being the cause? Do we have a history of this being an issue? Can we 100% confirm that this is the cause? There are many different tools and techniques that you can use at this phase and we will go through these in the next section.
Implement Solutions
Now it's time to implement solutions that you believe will address the root causes of your issues. Create a detailed action plan with specific tasks, responsible persons, and deadlines. It may be useful to implement immediate fixes to stop the problem, and then plan to implement long-term solutions in the future to prevent recurrence. This way you have stopped the problem temporarily, but have a plan in place to prevent it into the future.
Example:
- Immediate Solution: Recalibrate the assembly machine.
- Long-term Solution: Implement an automated maintenance reminder system and provide additional training to operators.
Monitor Results
Last but not least, you need to track the effectiveness of the solutions to ensure they are actually working, and make adjustments as necessary. You can do this by monitoring key performance indicators (KPIs) such as defect rates, production efficiency, and downtime. Make sure to regularly review the effectiveness of the implemented solutions and make adjustments where necessary.
Example:
- Results: After recalibrating the machine and implementing the reminder system, the defect rate dropped back to 2%. Ongoing training programs for operators are in place to ensure adherence to assembly techniques.
Root Cause Analysis Techniques
As mentioned previously, there are several common techniques that you can use to analyse the cause of an issue. The main 4 techniques are the 5 Why's technique, the Fishbone Diagram (otherwise known as Ishikawa), the Failure Mode and Effects Analysis (FMEA) and process mapping. We will now explain each of these techniques in detail.
5 Whys
The 5 Whys technique is a simple but powerful tool for uncovering the root cause of a problem by asking "Why?" multiple times. Typically, this involves asking "Why?" five times, though the actual number can vary depending on the complexity of the issue. Firstly, you need to identify the problem that needs to be resolved. Then, you can ask yourself the 5 whys as follows:
1. The First "Why?": Why is this problem occurring?
Example: Why is the defect rate high? Because components are frequently misaligned.
2. The Second "Why?": Why is the first identified cause happening?
Example: Why are components misaligned? Because the assembly machine is not calibrated properly.
3. The Third "Why?": Dig deeper into the second cause.
Example: Why is the machine not calibrated properly? Because the maintenance schedule was not followed.
4. The Fourth "Why?": Continue to drill down.
Example: Why was the maintenance schedule not followed? Because there is no automated reminder system.
5. The Fifth "Why?": Uncover the fundamental issue.
Example: Why is there no automated reminder system? Because the current maintenance system is outdated.
Identify the Root Cause: The answer to the fifth "Why?" usually reveals the root cause.
- Example: The root cause is the outdated maintenance system.
This method is a great one to use as its very simple and easy to implement. It doesn't require a lot of training and can get to the root of the problem very quickly. It also promotes a culture of deeply understanding all your processes and how they connect.
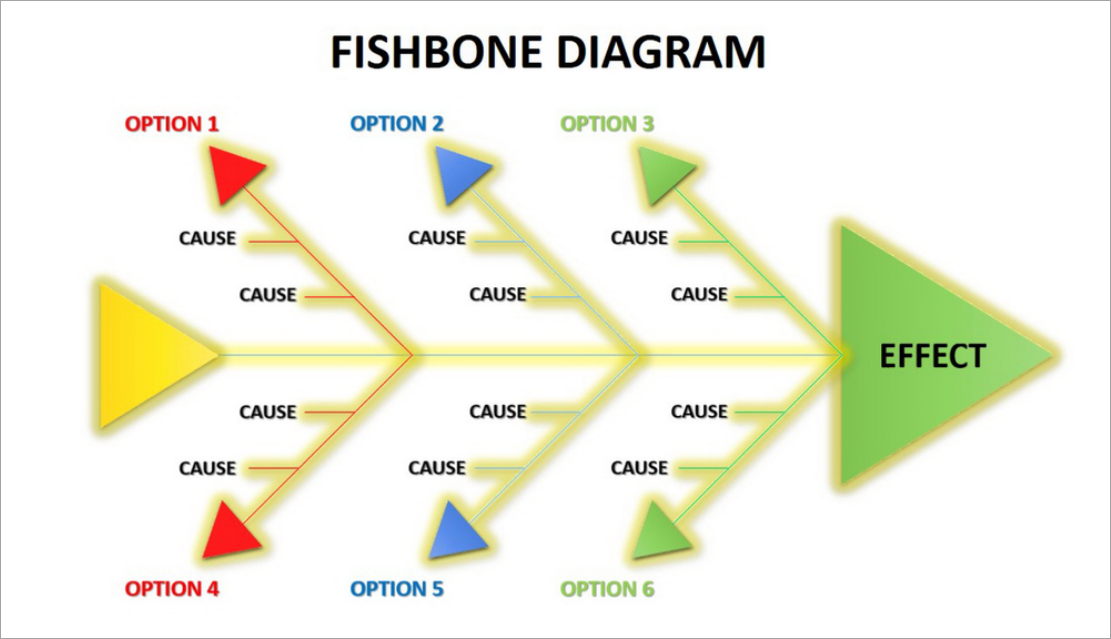
Fishbone Diagram (Ishikawa)
The Fishbone Diagram, also known as the Ishikawa or cause-and-effect diagram, is a visual tool that helps map out the potential causes of a problem, categorising them into major groups. To create a Fishbone Diagram, you start by clearly defining the problem and writing it down at the "head" of the fish-shaped diagram. For instance, if the problem is an increased defect rate in the final product, you would write this at the head.
Then, you draw a horizontal line with several branches coming off the spine of the fish. Each branch represents a major category that could be contributing to the problem, such as People, Methods, Machines, Materials, Measurements, and Environment.
For each category, you brainstorm potential causes and write them on the corresponding branch. For example, under "Methods," you might list "improper assembly techniques." Once the diagram is complete, you systematically review all the potential causes to identify which ones warrant further investigation. This tool is good because it provides a clear visual representation of potential causes and encourages thorough brainstorming and categorisation.
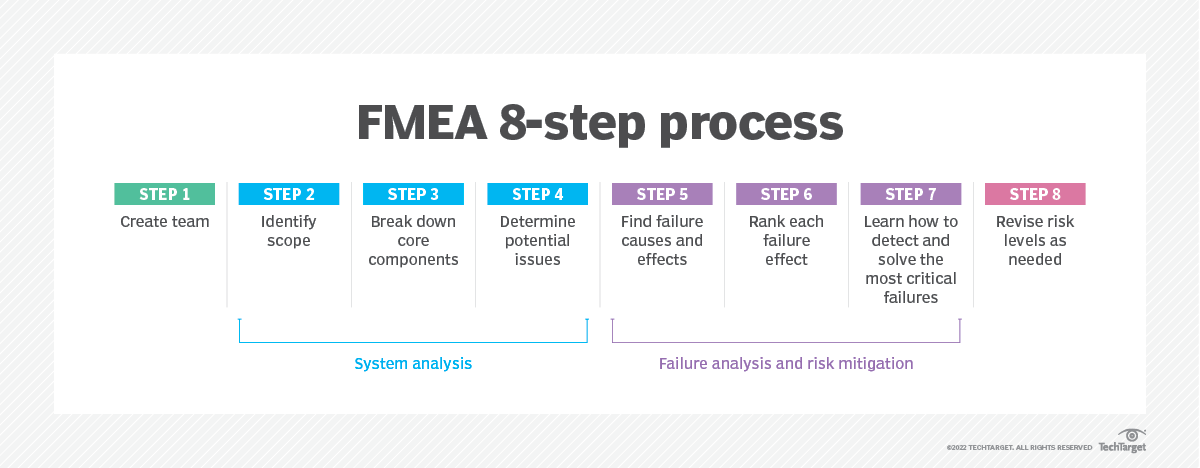
Failure Mode and Effects Analysis (FMEA)
This approach involves evaluating the different points of failure in a process, assessing their impact and then deciding on the likelihood that this was the root cause of the problem. The process looks something like this:
- Assemble a cross-functional team with diverse expertise to review the process or product in detail
- Identify all potential ways the process or product could fail, known as failure modes
- For each failure mode, determine the possible effects on the process, product, or customer, and assign a severity rating on a scale (usually from 1 to 10), with 10 being the most severe.
- Identify the root causes of each failure mode and rate the likelihood of occurrence.
- Evaluate the existing controls to detect each failure mode and rate their effectiveness. These ratings are then multiplied (Severity x Occurrence x Detection) to calculate a Risk Priority Number (RPN) for each failure mode. High RPNs indicate areas that require immediate attention.
- The team will then develop and implement action plans to reduce these risks and continuously monitors the process, updating the FMEA as needed.
This method is valuable because it helps prioritise issues based on risk, provides a structured approach to problem-solving, and enhances the reliability and safety of products and processes.
Process Mapping
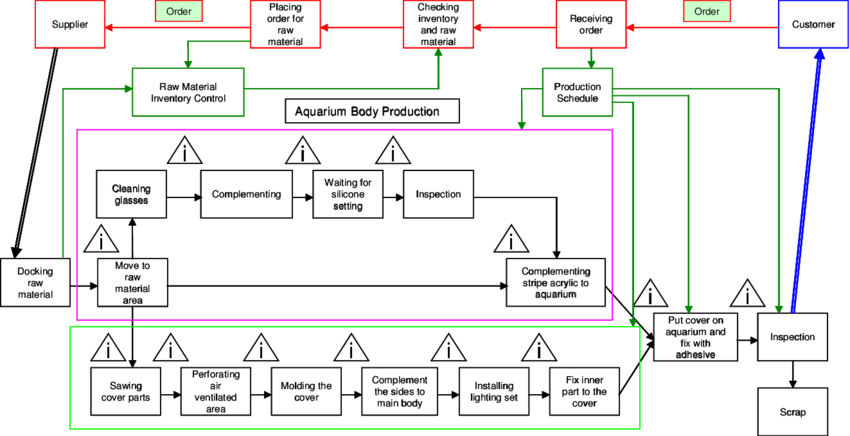
Finally, Process Mapping involves creating a detailed visual representation of the steps involved in a process to identify inefficiencies, bottlenecks, and error-prone areas. The first step is to define the scope of the process to be mapped, clearly outlining its boundaries. For instance, in a manufacturing setting, you might map out the assembly process of a product.
Next, gather detailed information about each step in the process from relevant stakeholders, such as operators, supervisors, and quality control staff. With this information, you identify the key steps in the process, such as receiving materials, assembling components, conducting quality inspections, and packaging the final product.
Using standard symbols, you draw the process map, representing different steps, decisions, and flows. For example, ovals can be used for start/end points, rectangles for process steps, and diamonds for decision points. Once the map is complete, you analyse it to identify inefficiencies, bottlenecks, and potential error points. This might reveal, for instance, a bottleneck at the quality inspection stage causing delays. Highlighting these areas allows you to develop action plans to improve the process, such as implementing additional quality inspection stations to reduce delays.
After implementing these changes, you update the process map accordingly and continuously monitor the process to ensure the improvements are effective. Process Mapping provides a clear visual overview of the entire process, helps identify and eliminate inefficiencies and bottlenecks, and facilitates communication and understanding among team members.
Here is an example of a process map for an aqaurium manufacturing firm:
Benefits of Root Cause Analysis
RCA offers numerous benefits in the manufacturing sector:
- Improved Quality: By addressing the fundamental issues, RCA leads to higher product quality and consistency.
- Cost Savings: Preventing recurring problems reduces waste, rework, and the cost of poor quality.
- Enhanced Efficiency: Streamlining processes and eliminating root causes of inefficiencies boosts overall productivity.
- Better Decision Making: RCA provides data-driven insights, leading to more informed and effective decision-making.
- Compliance and Safety: Identifying and resolving root causes of safety incidents ensures a safer workplace and helps meet regulatory requirements.
Conclusion
Root Cause Analysis is an indispensable tool in manufacturing, providing a structured approach to problem-solving that ensures long-term improvements in quality, efficiency, and safety. By employing techniques like the 5 Whys, Fishbone Diagram, FMEA, and Process Mapping, manufacturers can systematically identify and address the underlying causes of issues, leading to more robust and reliable production processes. Implementing RCA not only saves costs but also fosters a culture of continuous improvement, positioning manufacturers for sustained success.
FAQs
Q: How do I carry out a root cause analysis?
A: Carrying out a root cause analysis involves defining the problem, quantifying it's impact, assessing the different potential causes, identifying the root cause, and implementing fixes to address the cause of the issue. You can use techniques such as the 5 Whys, Fishbone Diagram, FMEA and Process Mapping to help you.
Q: What are the 5 M's of root cause analysis?
The 5 M's of root cause analysis refer to the different categories that you can use to identify causes. These include machine, method, material, man/mind power, and measurement/medium.
Q: What are the 5 steps of root cause analysis?
A: The 5 steps of root cause analysis are; define the problem, collect data, identify causal factors, identify root cause(s) and implement solutions.
Q: What are the 3 main objectives of root cause analysis?
A: The 3 main objectives of root cause analysis are to identify the root cause of a problem, to decide how to fix this problem, and to put measures in place to ensure this doesn't happen again in the future.


